
AUTOMATE, BUT KNOW YOUR NUMBERS

Cost pressure is packaging professionals' top concern. In the ALLFORPACK EMBALLAGE PARIS 2025 barometer, 65% of the professionals surveyed cite the price of materials as the main deciding factor in their choice of more sustainable packaging. Yet a large share of the cost of a pack is determined not by the material but on the packaging line: in minutes of downtime, adjustments, failed start-ups and products scrapped every time the line switches from one reference to another. These losses are rarely isolated in cost accounting. They are diluted in production costs, which explains why they so often remain invisible when an investment decision is being made. The food industry lives with this every day, with increasingly short production cycles, frequent format changes and smaller batch sizes.
Format changeovers, a hidden cost of the packaging line
A format changeover takes far more than the setting time shown on the schedule. It begins before the line stops, with tooling and consumables being prepared, and ends well after restart, once nominal speed has been reached and quality has stabilised. In between, the line produces nothing, or produces poorly. To measure this, the benchmark indicator is overall equipment effectiveness (OEE), known in France as TRS and defined by AFNOR standard NF E60-182, which governs performance indicators for production equipment. OEE combines three dimensions: line availability, performance against theoretical speed and the quality of output. A format changeover degrades all three at once. It reduces availability during the stop, lowers performance during the ramp-up and penalises quality until the settings are stable.
The regulatory context reinforces this trend. The EU Packaging and Packaging Waste Regulation (PPWR) is pushing manufacturers towards packaging that is recyclable, contains recycled content and is clearly labelled. Every change in material, grammage or marking translates on the line into new settings, new tooling and new learning phases. The wider the product portfolio and the shorter the batches, the larger the share of time spent on changeovers compared with genuinely productive time.
Packaging: putting a figure on the real cost of a changeover
The first step is to make this cost visible. The calculation is based on a few data points that any line can provide if they are recorded rigorously. The actual duration of a changeover, measured from the last good product of the previous run to the first good product of the next one, not the theoretical time on the schedule. The number of changeovers per week or per month. The full hourly cost of the line when stopped, including labour, equipment depreciation, energy and fixed costs. The value of lost production, if the line is running at full capacity and every hour of downtime is an hour of lost sales. Finally, the products and materials consumed at start-up, scrap and rework.
Multiplying the actual time of a changeover by the hourly cost of the line, then by the number of changeovers over the year, gives an initial order of magnitude that often surprises teams. On top of this come indirect effects, such as overtime to catch up, safety stocks built up to avoid multiplying changeovers, or orders turned down for lack of capacity. Lean organisation methods such as SMED (single-minute exchange of die) aim precisely to cut these times by moving as many operations as possible outside the line stoppage. They deliver real gains without heavy investment, but they quickly reach their limits when settings remain manual and depend on each operator's experience.
Automating a packaging line: what to include in the calculation
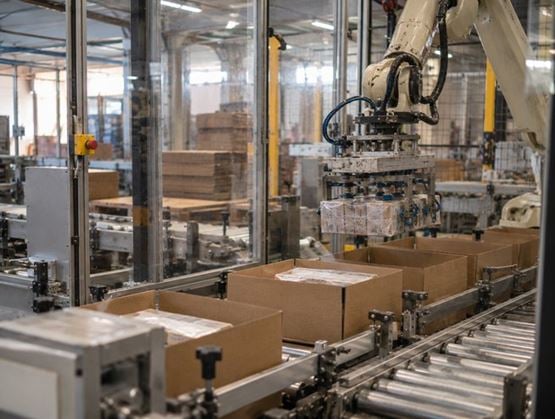
Automation changes the equation because it tackles both the duration of changeovers, through motorised adjustments and stored recipes, and their variability, since the result no longer depends on individual know-how. To assess its profitability, however, you have to resist the temptation to compare only the price of the machine with the labour hours saved. A credible return on investment calculation compares two complete columns.
On the cost side, the initial investment covers the equipment, integration with the existing line, formats and tooling, software and commissioning. Added to this are recurring costs: maintenance, spare parts, energy, service contracts, staff training and any production losses during installation. It is the total cost of ownership over the equipment's lifetime, not just the purchase price, that should serve as the basis.
On the gains side, there are more categories than you might think. Shorter changeover times free up capacity that can be sold or that avoids investing in a second line. Higher OEE increases output with the same workforce. Less scrap and rework reduces material consumption, an item all the more sensitive since material prices are the main obstacle cited by the profession. Stable settings improve quality and reduce non-conformities. Finally, automation addresses a very concrete labour constraint. According to the 2026 Labour Needs survey (Besoins en main-d'œuvre) by France Travail, 43.8% of recruitment projects are considered difficult, rising to 80.6% for machine tool operators. A line that relies less on scarce skills secures production as much as it lowers its cost.
The method for deciding before you invest
The calculation itself comes down to a few steps. Start from a reliable measurement of the current situation, with the line's current OEE, the actual average changeover time and the annual number of changeovers, ideally recorded over several representative weeks rather than estimated from memory. Then define the target state with the supplier, requiring quantified commitments on changeover time and speed, validated where possible in trials with real products and formats. Translate the gap between the two into euros, valuing each gain with the company's actual hourly costs and selling prices. Then calculate the payback period, that is, the total investment divided by the net annual gain, and refine it with a net present value over the equipment's lifetime to take account of the cost of capital. Finally, test how robust the result is with several scenarios, for example lower volumes, higher energy prices or a smaller OEE gain than announced. A project that remains profitable in the pessimistic scenario is a sound project.
This discipline is all the more useful as the gap in equipment between France and its neighbours remains a competitiveness issue. According to the International Federation of Robotics (IFR), average robot density in manufacturing in the European Union reached 231 robots per 10,000 employees in 2024, compared with a global average of 132. In packaging, where case packing, palletising and inspection lend themselves well to robotics, every well-calculated investment decision helps close this gap.
Comparing solutions in real conditions
An ROI table is no substitute for watching a machine change format before your eyes. This is one of the benefits of ALLFORPACK EMBALLAGE PARIS, whose 2027 edition will give greater prominence to machines in operation.
From Tuesday 29 June to Thursday 1 July 2027 at Paris Expo Porte de Versailles, the Packaging Machinery & Solutions exhibition sector will bring together manufacturers and integrators of filling, sealing, labelling, case packing and palletising lines. Production managers will be able to time a format changeover live, question suppliers on their speed and OEE commitments, and compare several technologies in a single day. Visitor itineraries by industry help purchasing, production and R&D teams target the exhibitors relevant to their project. For a manufacturer preparing an investment, three days at the show make it possible to test a profitability calculation against the reality of the equipment and turn an assumption into a decision.